


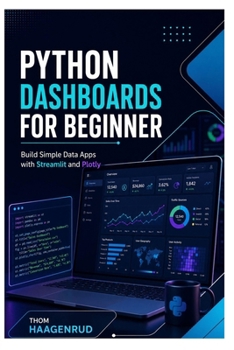
Python Dashboards for Beginners: Build Simple Data Apps with Streamlit and Plotly

Do you want to transform spreadsheets, CSV files, and raw data into clear, interactive dashboards without learning complicated web development?
Python Dashboards for Beginners is a practical, step-by-step guide to building simple data applications with Streamlit and Plotly. Designed for complete beginners, it shows you how to turn ordinary datasets into interactive charts, filters, reports, and dashboards that people can explore in a web browser.
Instead of overwhelming you with advanced programming theory, this book focuses on useful projects and visible results. You will learn how to load data, prepare it for analysis, create attractive visualizations, add interactive controls, display key performance indicators, and organize everything into a working dashboard.
Each lesson builds on skills you can apply to business reporting, research, education, finance, sales, operations, personal projects, and portfolio development.
Inside this book, you will learn how to:
- Understand how dashboards and data applications work
- Install Python, Streamlit, Plotly, and the required tools
- Load information from CSV and Excel files
- Clean and prepare data with pandas
- Create interactive bar, line, pie, and scatter charts
- Display metrics, tables, summaries, and key performance indicators
- Add buttons, sliders, dropdown menus, and date filters
- Organize dashboard content with columns, tabs, and sidebars
- Build sales, expense, survey, inventory, and performance dashboards
- Let users upload and explore their own datasets
- Improve dashboard layout, readability, and usability
- Handle common coding and data errors
- Publish and share simple Streamlit applications
- Create portfolio projects that demonstrate practical data skills
The projects are explained in plain language, with each step connected to a real purpose. You will understand not only what code to write but also how the different parts of an interactive dashboard work together.
This book is suitable for students, analysts, researchers, office professionals, entrepreneurs, freelancers, aspiring data scientists, and Python beginners who want to present information more clearly.
You do not need web-design experience or advanced mathematics. Basic computer skills and a willingness to practise are enough to begin.
Start turning static data into interactive experiences. Build useful dashboards, communicate insights more effectively, and create simple data applications that others can explore.
Customer Reviews
ThriftBooks ® and the ThriftBooks ® logo are registered trademarks of Thrift Books Global, LLC