


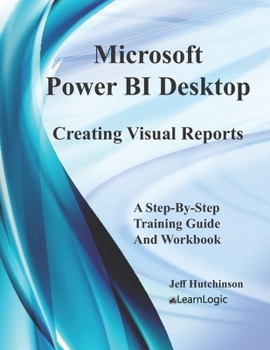
Microsoft Power BI Desktop - Creating Visual Reports
No Customer Reviews

In this workbook/guide, we will cover in detail the Power BI Desktop features (installed on your local computer) that can be used to create a Dashboard of different Visual Reports describing related tables. We will take students through a step-by-step process, concerning the capabilities including the following:
Power BI Tools - The workbook will cover the related tools and downloads including Power BI Desktop, Power BI Web Service, Power BI for Mobile, Power BI Publisher For Excel, Power BI Gateway, and Power BI Report Server.Process Overview - Here, we will take you through the process from Getting Data, Query Editor, Data View, Relationships, Visual Reports, Formatting, Filtering, Publishing on the Web to creating a Dashboard.Get Data - This will extract the data source from a database such as Excel, Access, etc.Query Editor - This will allow you to review data extracted and filter or remove specific records prior to saving it to the Power BI file.Data View - This will allow you to review structure of the data extracted and add additional fields as needed.Relationships - This will allow multiple tables to be added and related to a data source in order to obtain an accurate result when different fields are used.Visual Reports - This will generate different reports describing the data from different tables. These reports include Charts, Tables, Summary Information, Maps, etc.Filter Report - Once you create a report, it can be filtered to display the desired information.Format Report - Once you create a report, it can be formatted with any options available.Publish Report - Once reports are complete, they can be Published to a web browser version of Power BI and shared with others on the internet.Create A Dashboard - Once reports are Published, they can be organized into a Dashboard layout for others to preview.**************************************************************************************************************************
This workbook supports the September 2019 Update
What's is in the workbook?Video Clips - The Kindle version includes video clips for each practice exercise. You can request the Videos with your paperback book Amazon receipt.Take A Class - When you take a class using the workbook, you will be able to ask questions and gain a deeper understanding of many important concepts. http: //www.elearnlogic.com/courseware.htmlHighly Requested Topics - The following are topics covered in the workbook: Automatically Find Clusters, Edit Interactions, Drill Down for more detail, New Hierarchy, Drill Through, Conditional Formatting, New Group, Visual Report Tab Order, New Filter Experience, New Modeling View, Query Editor, New Measure, Data Source Relationships, and the Publishing process.*****************************************************************************************************************************
Power BI Tools - The workbook will cover the related tools and downloads including Power BI Desktop, Power BI Web Service, Power BI for Mobile, Power BI Publisher For Excel, Power BI Gateway, and Power BI Report Server.Process Overview - Here, we will take you through the process from Getting Data, Query Editor, Data View, Relationships, Visual Reports, Formatting, Filtering, Publishing on the Web to creating a Dashboard.Get Data - This will extract the data source from a database such as Excel, Access, etc.Query Editor - This will allow you to review data extracted and filter or remove specific records prior to saving it to the Power BI file.Data View - This will allow you to review structure of the data extracted and add additional fields as needed.Relationships - This will allow multiple tables to be added and related to a data source in order to obtain an accurate result when different fields are used.Visual Reports - This will generate different reports describing the data from different tables. These reports include Charts, Tables, Summary Information, Maps, etc.Filter Report - Once you create a report, it can be filtered to display the desired information.Format Report - Once you create a report, it can be formatted with any options available.Publish Report - Once reports are complete, they can be Published to a web browser version of Power BI and shared with others on the internet.Create A Dashboard - Once reports are Published, they can be organized into a Dashboard layout for others to preview.**************************************************************************************************************************
This workbook supports the September 2019 Update
What's is in the workbook?Video Clips - The Kindle version includes video clips for each practice exercise. You can request the Videos with your paperback book Amazon receipt.Take A Class - When you take a class using the workbook, you will be able to ask questions and gain a deeper understanding of many important concepts. http: //www.elearnlogic.com/courseware.htmlHighly Requested Topics - The following are topics covered in the workbook: Automatically Find Clusters, Edit Interactions, Drill Down for more detail, New Hierarchy, Drill Through, Conditional Formatting, New Group, Visual Report Tab Order, New Filter Experience, New Modeling View, Query Editor, New Measure, Data Source Relationships, and the Publishing process.*****************************************************************************************************************************
Format:Paperback
Language:English
ISBN:108158890X
ISBN13:9781081588908
Release Date:July 2019
Publisher:Independently Published
Length:242 Pages
Weight:1.26 lbs.
Dimensions:0.5" x 8.5" x 11.0"
Customer Reviews
0 rating
Copyright © 2026 Thriftbooks.com
Terms of Use | Privacy Policy | Do Not Sell/Share My Personal Information | Cookie Policy | Cookie Preferences | Accessibility Statement
ThriftBooks ® and the ThriftBooks ® logo are registered trademarks of Thrift Books Global, LLC
ThriftBooks ® and the ThriftBooks ® logo are registered trademarks of Thrift Books Global, LLC