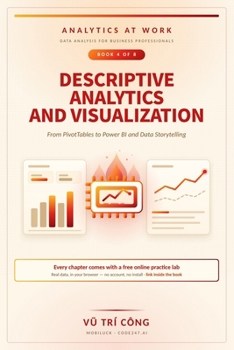
Descriptive Analytics and Visualization: From PivotTables to Power BI and Data Storytelling

A report that answers a diagnostic question with a descriptive picture wastes everyone's time. This book runs from the pivot table to a tested executive dashboard, by way of the analyses that actually explain a change.
Ten bad charts are rebuilt in full, and the last chapter is the one-page memo that turns a finding into a decision.
What you will be able to doVariance, the price-volume-mix bridge, cohorts, retention and lead timesConcentration, seasonality, trend and residual - read correctlyWhat a chart encodes, how to choose one, and the axis that liesThe model behind a dashboard, and the same measure in DAX and in SQLDesigning an executive dashboard and testing it with three usersWho it is forAnalysts and managers who publish reports, and anyone whose dashboard is being ignored.
The labsEvery chapter ends with a practice lab. Each one can be worked in the tools you already have, or in a free browser version that checks your answer as you go - no account, no install. The address is printed inside the book.
About the seriesAnalytics at Work is an eight-book series for business professionals. All eight run on the same thirty-six months of enterprise data from Cedar Ridge Brands, a fictional American consumer-goods maker. This is Book 4 of 8.
Customer Reviews
ThriftBooks ® and the ThriftBooks ® logo are registered trademarks of Thrift Books Global, LLC