
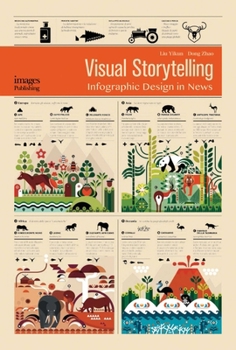
Visual Storytelling: Infographic Design in News
No Customer Reviews

How do data journalism designers overcome information overload in today's fast-paced environment, and find simple and compelling methods to filter and convey news content? One of the most effective ways is to use dynamic infographics and data visualisations. The use of powerful graphics and illustrations will capture the viewer's attention and interest, and by burying boring data creatively, strong graphics will provide a clever and compelling visual story that's driven by accessible and clear communication. This book introduces the developmental history and characteristics of data journalism, describing its classification and the features of journalism published by world-renowned media. It focuses on the design and production of data journalism, explaining the basic elements of design, common design methods and includes showcase designs from the simple to the very complex. This volume helps show how and where to find opportunities to use creative graphics and illustrations, including hand-painted illustrations. This book is a must-have for professional designers and design students, or those readers who are interested in compelling visual storytelling through design.
Format:Hardcover
Language:English
ISBN:186470649X
ISBN13:9781864706499
Release Date:June 2017
Publisher:Images Publishing Group
Length:240 Pages
Weight:1.45 lbs.
Dimensions:1.1" x 8.1" x 12.0"
Related Subjects
DesignCustomer Reviews
0 rating
Copyright © 2026 Thriftbooks.com
Terms of Use | Privacy Policy | Do Not Sell/Share My Personal Information | Cookie Policy | Cookie Preferences | Accessibility Statement
ThriftBooks ® and the ThriftBooks ® logo are registered trademarks of Thrift Books Global, LLC
ThriftBooks ® and the ThriftBooks ® logo are registered trademarks of Thrift Books Global, LLC
