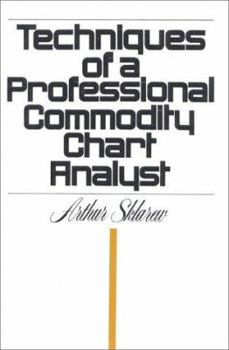
Techniques of a Professional Commodity Chart Analyst
Select Format
Select Condition 
Book Overview
Success in commodity trading depends on good price forecasting. That's what this market classic is about. Using price charts (and other simple technical indicators) to time your trades better, spot price trends, estimate the distance a new price thrust will travel, locate logic points for buy and sell stops, and identify potential trend reversal points. Deceptively simple strategy and tactics coaxes price charts to give up their secrets.
Format:Hardcover
Language:English
ISBN:0910418101
ISBN13:9780910418102
Release Date:January 1998
Publisher:Windsor Books/Probus
Length:180 Pages
Weight:1.19 lbs.
Dimensions:0.8" x 6.2" x 9.3"
Customer Reviews
1 rating
Highly recommended
Published by Thriftbooks.com User , 18 years ago
If you take only one of the many techniques explained in this book, you will profit. For example "Net Change Oscillators": Simple averages are the sum of a number of values divided by the number. As we move along the time line, the oldest value is dropped off and the latest value is added on. The change in the average is the difference between the latest and the oldest (i.e. the net change) divided by the number. The change in the average is called the velocity of price change; therefore, the net change is a measure of that velocity. When the net change is plotted along a time line, it oscillates across a zero line. This is called the net-change oscillator (NCO). Now let me describe a phenomenon that has given correct signals nine times out of ten in the course of many years of trading commodities, bank bills, indexes, and currencies. The method is dead-simple: in an uptrend, you draw a guideline across the bottom tips of NCO, in a downtrend the guideline is drawn across the top tips. When the NCO penetrates the guideline, a trend change is imminent[...] This book is highly recommended.


