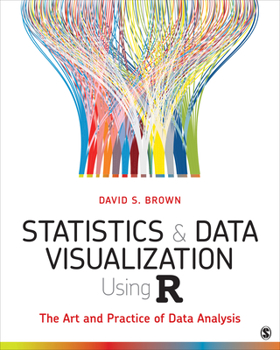
Statistics and Data Visualization Using R: The Art and Practice of Data Analysis
Designed to introduce students to quantitative methods in a way that can be applied to all kinds of data in all kinds of situations, Statistics and Data Visualization Using R: The Art and Practice of Data Analysis by David S. Brown teaches students statistics through charts, graphs, and displays of data that help students develop intuition around statistics as well as data visualization skills. By focusing on the visual nature of...
Format:Paperback
Language:English
ISBN:1544333862
ISBN13:9781544333861
Release Date:September 2021
Publisher:Sage Publications, Inc
Length:616 Pages
Weight:2.45 lbs.
Dimensions:1.0" x 7.9" x 9.9"
Related Subjects
Computers Computers & Technology Math Mathematics Science & Math Social Science Social SciencesCustomer Reviews
0 rating


