All Formats & Editions
1 - 2 of 2 results found

Interactive Web-Based Data Visualization with R...
Edition Description
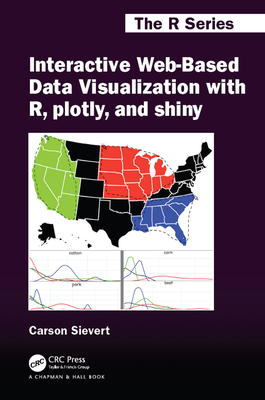
The richly illustrated Interactive Web-Based Data Visualization with R, plotly, and shiny focuses on the process of programming interactive web graphics for multidimensional data analysis. It is written for the data analyst who wants to leverage the capabilities of...
Edition Details
Format:Paperback
Language:English
ISBN:1138331457
Format: Paperback
Condition:
$
97.99
50 Available

Interactive Web-Based Data Visualization with R...
Edition Description
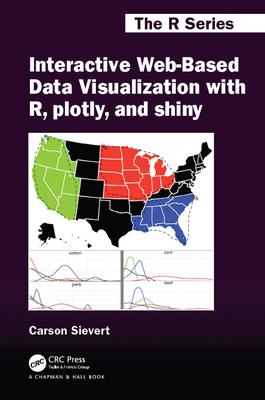
This book describes interactive data visualization using the R package plotly. It focuses on tools and techniques that data analysts should find useful for asking follow-up questions from their data using interactive web graphics. A basic understanding of R is assumed.
Edition Details
Format:Hardcover
Language:English
ISBN:113833149X
Format: Hardcover
Condition:
$
240.00
50 Available


