
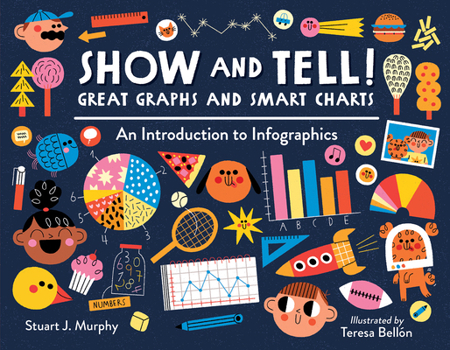
Show and Tell! Great Graphs and Smart Charts: An Introduction to Infographics
No Customer Reviews

Select Format
Select Condition 
Book Overview
A visual-learning expert races up the charts and graphs math success with kid-friendly content sure to help with homework. Want to find the most popular meal in the cafeteria? Compare town sports enrollments? Or maybe you just want to know who burps the most in your family! Learn what line graphs, bar graphs, pie charts, and pictographs are and how and when to use them to represent data. Each project shows how to build a chart or graph and ties it all together with a creative infographic that really puts the A in STEAM (Science, Technology, Engineering, ARTS, and Mathematics). Whether used as an introductory aid or to underscore previous knowledge, the book prepares today's visually savvy children to succeed in school and life by analyzing the world around them.
Format:Paperback
Language:English
ISBN:1623541751
ISBN13:9781623541750
Release Date:October 2022
Publisher:Charlesbridge Publishing
Length:48 Pages
Weight:0.65 lbs.
Dimensions:0.2" x 8.3" x 10.9"
Age Range:6 to 9 years
Grade Range:Grades 1 to 4
Customer Reviews
0 rating
Copyright © 2025 Thriftbooks.com
Terms of Use | Privacy Policy | Do Not Sell/Share My Personal Information | Cookie Policy | Cookie Preferences | Accessibility Statement
ThriftBooks ® and the ThriftBooks ® logo are registered trademarks of Thrift Books Global, LLC
ThriftBooks ® and the ThriftBooks ® logo are registered trademarks of Thrift Books Global, LLC
