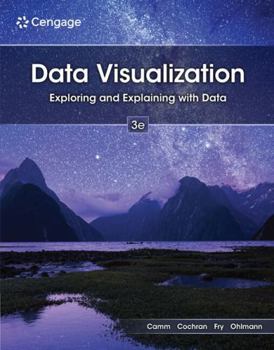
Data Visualization: Exploring and Explaining with Data
No Customer Reviews

Camm/Cochran/Fry/Ohlmann's "Data Visualization: Exploring and Explaining With Data," 3rd Edition gives you a strong foundation in data visualization best practices, whether you're an undergraduate or graduate student. With a focus on career readiness, this edition helps you develop practical data visualization and communication skills that are increasingly valuable across today's data-driven workplace. You'll build these skills by learning effective design, use of color, and chart type selection, as well as how to visually explore data and explain concepts and results. New software lab sections help you gain hands-on experience using industry-relevant tools, providing step-by-step instructions for building data visualizations in Excel, Power BI, and Tableau. A new chapter on artificial intelligence explores how you can use AI collaboratively to improve data analysis, develop more effective visualizations, and communicate insights responsibly. Drawing on real-world examples from accounting, finance, operations, human resources, sports, politics, science, and economics, this edition is a helpful resource as you learn to influence with, and be informed by, data.
Format:Paperback
Language:English
ISBN13:9798214516332
Release Date:January 1
Publisher:Cengage Learning
Length:700 Pages
Customer Reviews
0 rating
Copyright © 2026 Thriftbooks.com
Terms of Use | Privacy Policy | Do Not Sell/Share My Personal Information | Cookie Notice | Cookie Preferences | Accessibility Statement
ThriftBooks ® and the ThriftBooks ® logo are registered trademarks of Thrift Books Global, LLC
ThriftBooks ® and the ThriftBooks ® logo are registered trademarks of Thrift Books Global, LLC