


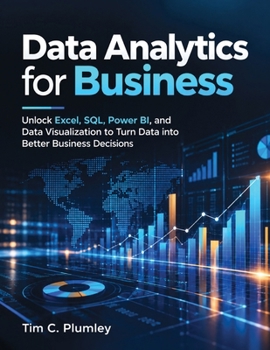
DATA ANALYTICS FOR BUSINESS: Unlock Excel, SQL, Power BI, and Data Visualization to Turn Data into Better Business Decisions (Precision Engineering)

Are you spending hours cleaning spreadsheets, fixing formulas, and rebuilding the same reports every month?
Do you have plenty of business data but struggle to turn it into answers you can trust? When numbers do not match, can you tell whether the problem is the data, the calculation, the model, or the business itself?
Data Analytics for Business gives you a practical path from business questions to trustworthy analysis and better decisions.
This is not a collection of disconnected Excel formulas, SQL commands, or Power BI features. It shows you how to connect Excel, Power Query, SQL, Power BI, DAX, and data visualization into one coherent analytical workflow.
You will learn how to move:
From messy data to structured analytical information.
From manual spreadsheet work to repeatable data preparation.
From isolated formulas to relational SQL thinking.
From raw tables to reliable Power BI models.
From confusing calculations to dependable DAX measures.
From attractive charts to purposeful visualization.
From "something changed" to understanding why it changed.
From reporting what happened to supporting better decisions.
You will learn how to:
Translate business objectives into precise analytical questions
Define KPIs, measures, dimensions, targets, and decision criteria
Build maintainable Excel models and automate data preparation with Power Query
Query relational data with SQL while avoiding incorrect joins and duplicate aggregation
Design Power BI star schemas, transformation pipelines, and reliable DAX measures
Analyze trends, anomalies, segments, profitability, and business performance
Choose visualizations based on analytical purpose-not decoration
Build interactive reports and executive KPI dashboards
Diagnose changes across customers, products, regions, volume, price, and mix
Evaluate scenarios, assumptions, trade-offs, uncertainty, and business impact
Automate recurring analytics with governance, security, quality, and performance practices
Just as importantly, you will learn to question your results.
Why did a join unexpectedly double the revenue?
Why does the total look correct while individual regions are wrong?
Why does a Power BI measure change when a filter is applied?
Why can a year-over-year comparison mislead?
Is an unusual number a genuine business event or a data-quality problem?
Instead of relying on trial and error, you will develop a structured approach to validate, troubleshoot, explain, and improve analytical results.
Whether you are an aspiring data analyst, experienced Excel user, manager, entrepreneur, or business professional, this book helps you move beyond working with data toward thinking analytically about business performance.
You do not need to become a data engineer. You need to understand how business questions, data, models, calculations, visualizations, validation, and decisions fit together.
Turn the data you already have into analysis you can trust-and decisions you can defend.
Customer Reviews
ThriftBooks ® and the ThriftBooks ® logo are registered trademarks of Thrift Books Global, LLC