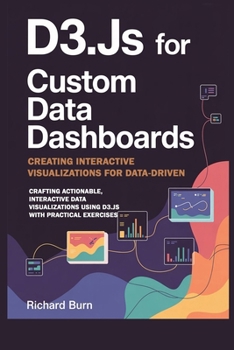
D3.js for Custom Data Dashboards: Creating Interactive Visualizations for Data-Driven Insights with 40 Hands-On Exercises : Crafting Actionable, Inter
Are you ready to turn raw data into stunning, interactive dashboards that inspire action?
Do you want to master D3.js-the same library used by Netflix, The New York Times, and Fortune 500 companies-to craft visualizations that truly stand out?
In a world overflowing with data, the ability to create clear, engaging, and interactive dashboards isn't just a skill-it's a career superpower. D3.js for Custom Data Dashboards: Creating Interactive Visualizations for Data-Driven Insights with 40 Hands-On Exercises gives you the tools, techniques, and confidence to transform complex datasets into compelling stories that drive decisions.
Format:Paperback
Language:English
ISBN:B0FRLFC1LZ
ISBN13:9798265659415
Release Date:September 2025
Publisher:Independently Published
Length:250 Pages
Weight:0.75 lbs.
Dimensions:0.5" x 6.0" x 9.0"
Customer Reviews
0 rating


